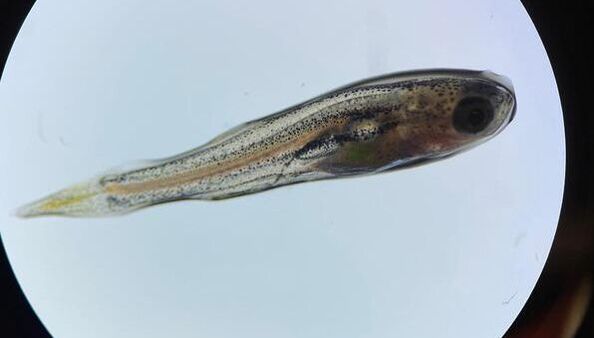
Zebrafish (Danio rerio)
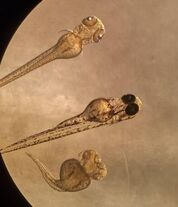
We recently introduce the zebrafish model to study gastric dysrhythmia. The strength in using the zebrafish model is that their larvae are transparent, in which we can see through their body and capture the movement of the gastrointestinal tract directly under a light microscope in living zebrafish larvae.
|
|
|
The diabetes model
We induce diabetes using 3 different approaches:
- Standard diet (SD): Larvae fed with 20 mg of 15 µm Gemma-diet (powdered) per 100 larvae
- Overfeeding model (ED): Larvae fed with 120 mg per 100 larvae, 6 times the standard diet (Zang, Shimada & Nishimura, 2017)
- High fat diet model (HFD): 0.2 ml of 5 % egg yolk solution during one feeding (Landgraf et. Al., 2017)
- Glucose immersion (SD-G): Submerged at 3 dpf in 29 mmol/L glucose medium changed daily (Jung et al., 2015) and fed with standard diet at 5 dpf.
Data analytical methods
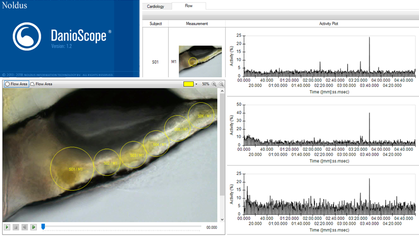
Danioscope is used to determine the overall percentage (%) change of pixels in a time-lapse video within the region of interest.
|

PIVlab is used to determine the displacement vector. A series of time-lapse images are divided into a grid with XY coordinates and it allocates the displacements into vector fields using Fourier transform correlation (Ganz, et. al., 2018; Thielicke, W. & Stamhuis, 2014).
|
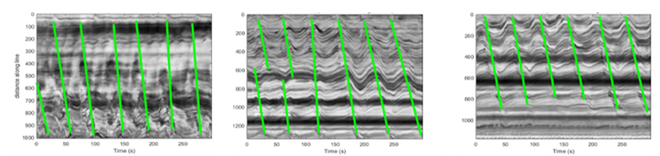
Kymographs are used to determine the intensity differences in time-lapse videos. Anterograde (green) actions can be observed using this type of analysis.
References
Capiotti, K. M. et al. Persistent impaired glucose metabolism in a zebrafish hyperglycemia model. Comp. Biochem. Physiol. Part - B Biochem. Mol. Biol. 171, (2014).
Ganz, J. et al. Image velocimetry and spectral analysis enable quantitative characterization of larval zebrafish gut motility. Neurogastroenterol. Motil. 30, (2018).
Gleeson, M., Connaughton, V. & Arneson, L. S. Induction of hyperglycaemia in zebrafish (Danio rerio) leads to morphological changes in the retina. Acta Diabetol. 44, (2007).
Jung SH, Kim YS, Lee YR, Kim JS. High glucose-induced changes in hyaloid-retinal vessels during early ocular development of zebrafish: a short-term animal model of diabetic retinopathy. Br J Pharmacol. 2016;173(1):15-26. doi:10.1111/bph.13279
Kikuchi, K., Noh, H., Numayama-Tsuruta, K. & Ishikawa, T. Mechanical roles of anterograde and retrograde intestinal peristalses after feeding in a larval fish (Danio rerio). Am. J. Physiol. - Gastrointest. Liver Physiol. 318, (2020).
Landgraf, K. et al. Short-term overfeeding of zebrafish with normal or high-fat diet as a model for the development of metabolically healthy versus unhealthy obesity. BMC Physiol. 17, (2017).
Rich, A. Improved Imaging of Zebrafish Motility. Neurogastroenterology and Motility vol. 30 (2018).
Thielicke, W. & Stamhuis, E. J. PIVlab – Towards User-friendly, Affordable and Accurate Digital Particle Image Velocimetry in MATLAB. J. Open Res. Softw. 2, (2014).
Tingaud-Sequeira, A., Ouadah, N. & Babin, P. J. Zebrafish obesogenic test: A tool for screening molecules that target adiposity. J. Lipid Res. 52, (2011)
Zang, L., Shimada, Y. & Nishimura, N. Development of a Novel Zebrafish Model for Type 2 Diabetes Mellitus. Sci. Rep. 7, (2017).